Collaborators:
David Delgado, Brandon Garff, Sona George, and Hailey Hendriks. In addition, the class compiled its data in order to obtain an average for each result.
David Delgado, Brandon Garff, Sona George, and Hailey Hendriks. In addition, the class compiled its data in order to obtain an average for each result.
Image credit: Florida Native Plant Society Blog.
Introduction & Problem:
How many days of school did Wake County cancel last school year due to snow? A week or so is what I would guess. However, this number would have been greater if it were not for the salt used to deice our roads. According to National Geographic, U.S. officials applied about 17 million tons of salt to roads this last winter (Howard, Brian C.). 17 million tons is an insignificant value to most of us, but after we observe how a few grams of sodium chloride can affect vegetation, perhaps we will adopt a different outlook on this environmental risk. Therefore, we will conduct a dose-response experiment in order to answer the following question: How do radish seeds respond to various concentrations of salt? By creating serial dilutions of a salt solution, we will attempt to answer this question. Ultimately, this experiment will also allow us to determine which concentration of salt allows the most seeds to germinate, and grow the longest roots. By determining the optimal salt concentration for vegetative growth, we will be able to understand why it is an environmental hazard to expose our environment to high levels of sodium chloride. This lab is a dose-response experiment, and can therefore be classified as a risk assessment. Thus, this lab can be also be used to estimate the risk involved in exposing vegetation to various concentrations of salt. The most important part of this assessment is that it can be applied to understanding the environmental issue explained above. Although we are making our lives easier by applying salt on our highways during snow days, it is our job to determine how this affects the growth of vegetation along the roadside and aquatic plants in nearby streams.
Hypothesis:
If the concentration of salt solution is increased, then the germination and radicle growth of radish seeds will be hindered as toxic levels of salt enter the system and limit their ability to absorb water that is needed for growth.
Parts of the Experiment:
Materials & Methods:
a) Materials:
b) Method:
Part 1: Preparing Serial Dilutions of a Salt Solution
a) Data (Class Averages):
How many days of school did Wake County cancel last school year due to snow? A week or so is what I would guess. However, this number would have been greater if it were not for the salt used to deice our roads. According to National Geographic, U.S. officials applied about 17 million tons of salt to roads this last winter (Howard, Brian C.). 17 million tons is an insignificant value to most of us, but after we observe how a few grams of sodium chloride can affect vegetation, perhaps we will adopt a different outlook on this environmental risk. Therefore, we will conduct a dose-response experiment in order to answer the following question: How do radish seeds respond to various concentrations of salt? By creating serial dilutions of a salt solution, we will attempt to answer this question. Ultimately, this experiment will also allow us to determine which concentration of salt allows the most seeds to germinate, and grow the longest roots. By determining the optimal salt concentration for vegetative growth, we will be able to understand why it is an environmental hazard to expose our environment to high levels of sodium chloride. This lab is a dose-response experiment, and can therefore be classified as a risk assessment. Thus, this lab can be also be used to estimate the risk involved in exposing vegetation to various concentrations of salt. The most important part of this assessment is that it can be applied to understanding the environmental issue explained above. Although we are making our lives easier by applying salt on our highways during snow days, it is our job to determine how this affects the growth of vegetation along the roadside and aquatic plants in nearby streams.
Hypothesis:
If the concentration of salt solution is increased, then the germination and radicle growth of radish seeds will be hindered as toxic levels of salt enter the system and limit their ability to absorb water that is needed for growth.
Parts of the Experiment:
- The control group consists of the 10 mL of distilled water (container #6).
- The experimental group consists of the radish seeds being exposed to various concentrations of salt.
- The independent variable is the concentration of salt solutions in g NaCl/L H2O (dose).
- The dependent variables are the percentage of seeds that germinated and radicle growth (response).
- The controlled variables include the incubation period, the room temperature, the amount of water each plant receives, and the amount of light each plant is exposed to, the number of radish seeds per petri dish, and the materials.
Materials & Methods:
a) Materials:
- 6 beakers with lids
- tape for labeling beakers and petri dishes
- 10 mL graduated cylinder
- distilled water
- "concentrated salt solution" = 12.0 grams table salt (sodium chloride) / 1 L distilled water
- 6 - 90 mm petri dishes with lids
- 3 pieces of unbleached paper towel
- 60 radish seeds (10 per petri dish)
- pencil
- plastic bag
- metric ruler
- calculator
- 2 sheets graph paper
b) Method:
Part 1: Preparing Serial Dilutions of a Salt Solution
- Obtain 6 beakers and label them with the following salt concentrations: 12.0 g/L, 6.0 g/L, 3.0 g/L, 1.5 g/L, 0.75 g/L and Control. See Table 1. Salt Solutions.
- Add 10 mL of distilled water to beakers #2-6.
- Measure 20 mL of the concentrated solution (12.0 g/L) and pour into beaker #1.
- Transfer 10 mL of salt solution from beaker #1 to beaker #2.
- Gently swirl beaker #2 to mix the salt solution.
- Repeat steps 4 and 5 for beakers #3-5 measuring 10 mL each time. DO NOT add any salt solution to test tube #6. This means that beaker #5 will be the only one to have 20 mL of a solution instead of 10 mL.
- Measure 10 mL of distilled water into beaker #6 to serve as the control. The control will indicate whether or not your seeds are viable (capable of growing or developing).
- Unless you will be using the solutions right away, cover them tightly with plastic wrap to prevent water loss through evaporation (in this case cover the beakers with their lids).
- Obtain six petri dishes. Label each dish according to the concentration of salt solution to be tested. See Table 1. Salt Solution Concentrations.
- Fold a half of sheet of paper towel or coffee filter into quarters. Cut it out so that it fits into the bottom of the petri dish.
- Measure 6 ml of salt solution and pour onto the paper towel in the appropriate petri dish. In the control dish, add 5 mL of distilled water. The purpose of a control is to identify how well the seeds will grow without any salt (duh!). Remember to start with the lowest salt solution (distilled water) in order to avoid contaminating the graduated cylinder with a higher salt solution.
- Add 10 radish seeds to each petri dish. Space the seeds out evenly on the paper towel so that they do not touch each other or the sides of the dish.
- Place the dishes in a plastic bag and seal it to retain moisture. Label your group/s name on the outside of the bag. It is also acceptable to place a lid on each petri dish and seal it with tape.
- Incubate the seeds in a dark place at a constant temperature (preferably 24.5oC) for 4-5 days.
- Inspect radish seeds during incubation period. Record any observations. If the paper seems dry, add 1 or 2 more millimeters of the appropriate salt solution or distilled water (control).
- Remove the lid of the control dish. Count the number of seeds that germinated (sprouted). Calculate the percentage of seeds that germinated and record in Table 2. Radish Seed Results.
- To measure the length of the radicle (embryonic root), carefully remove the germinating radish seed from the paper towel in one piece. The radicle may be growing into the layers of towel and can break if you pull too hard.
- Measure the length of the radicle for each of the germinating radish seeds to the nearest millimeter (mm). Look carefully at each sprout to make sure you are measuring just the root, not the shoot as well. In the picture below, you would measure just the part between the two arrows, not the shoot and cotyledons to the Ieft. Record data in Table 2. Radish Seed Results.
- Repeat steps 1-3 for each petri dish.
- For each treatment, calculate the mean (arithmetic average) radicle length for each salt solution. Add the total radicle lengths for each salt solution and divide by the total number of seeds that germinated. DO NOT include data from seeds that did not germinate. Record data in column labeled "Mean Radicle Length (mm)" in Table 2. Radish Seed Results.
- Make a line graph from the data collected to show a dose-response curve. The horizontal axis should be for the independent variable, dose (concentration of salt solutions). The vertical axis should be for the dependent variable, response (mean radicle length). Draw and label the axes. In your group you will need to come to some agreement about scales for these by looking at your data. Remember to give your graph a title.
- To help you answer the following question: "Did the radicle length increase or decrease in length as compared to the control?" subtract the mean radicle length of each treatment (T) from the mean radicle length of the control (C). Record your answers in the column, "Difference in Radicle Length" on Table 2.
- Make a line graph to show the percentage of seeds that germinated for each salt solution.
- Complete your lab report.
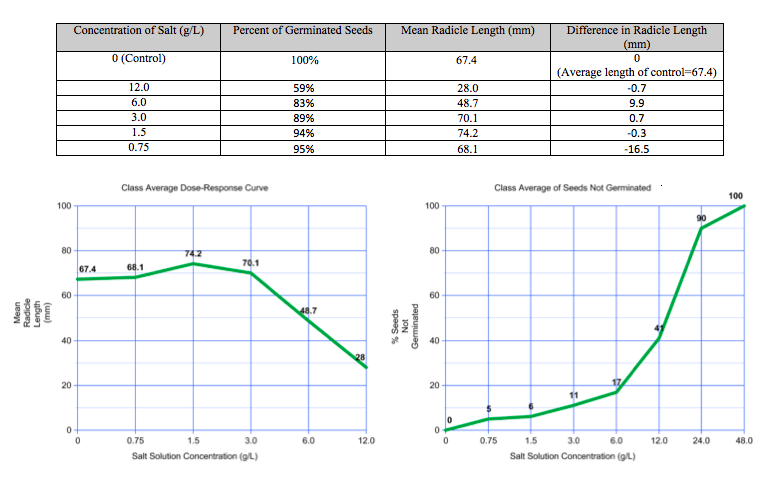
a) Data (Class Averages):
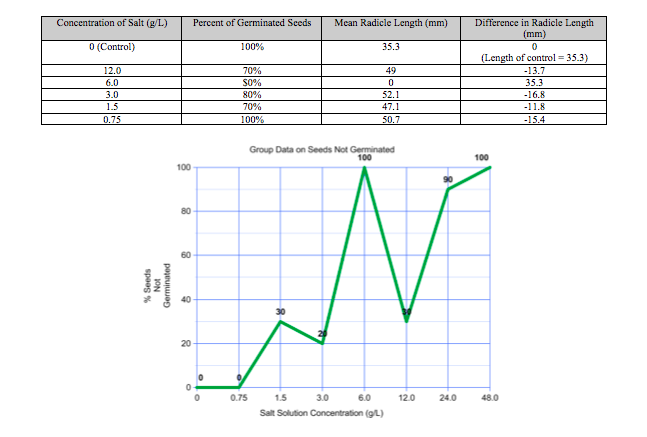
Group Data:
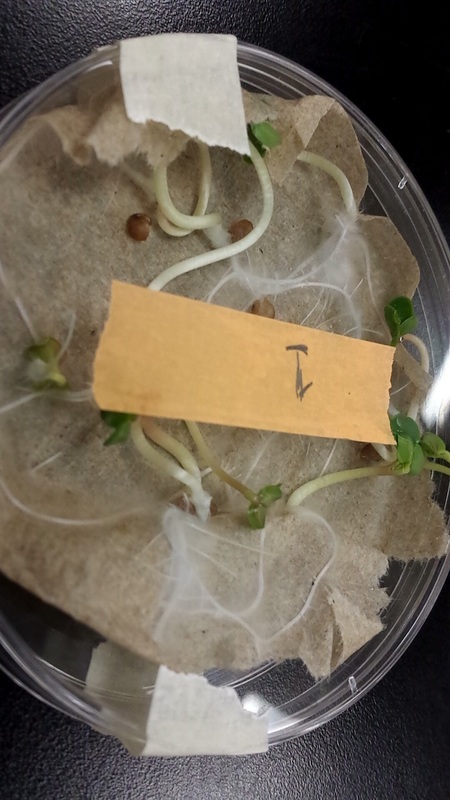
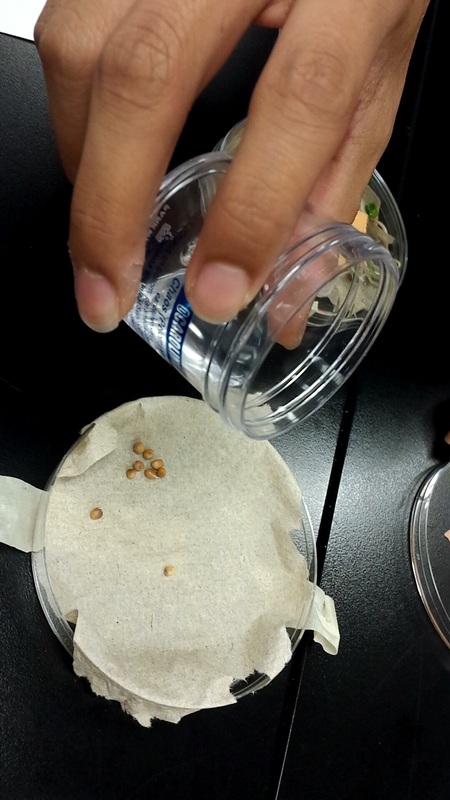
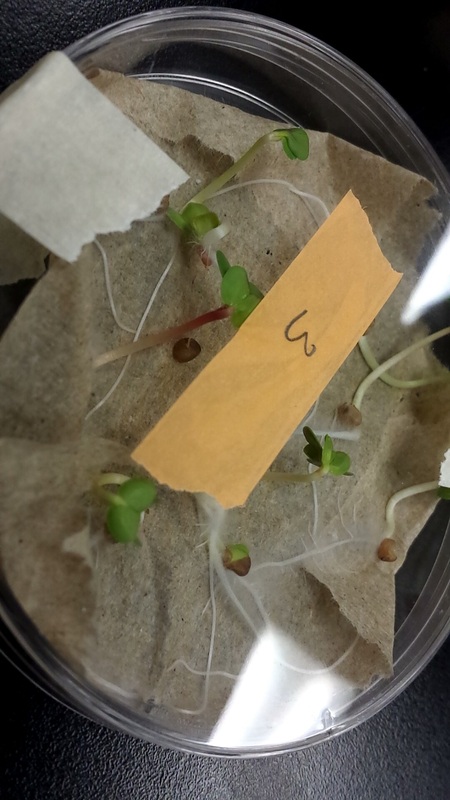
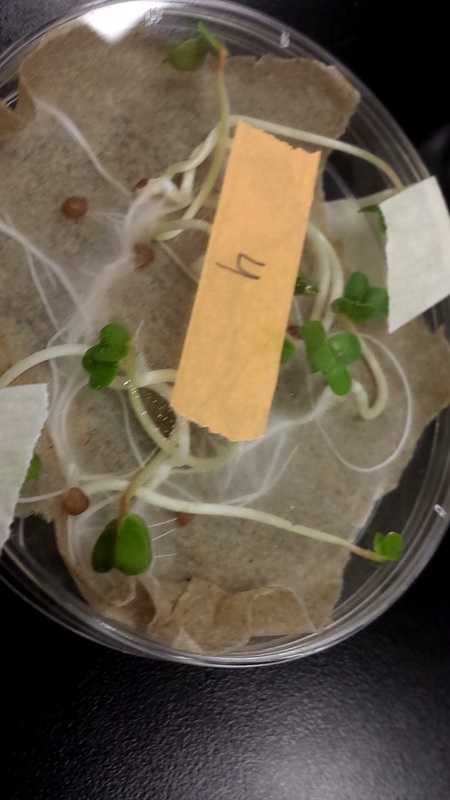
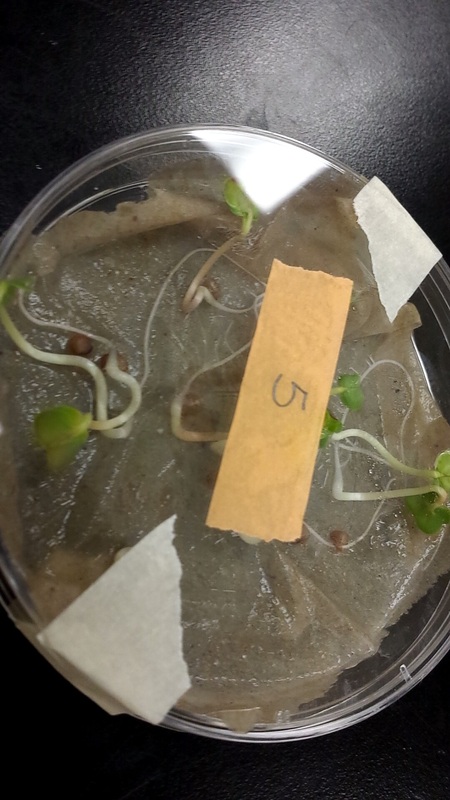
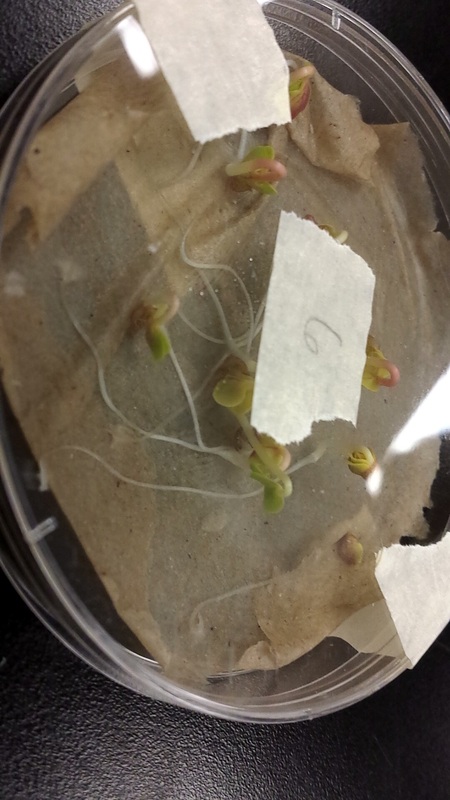
b) Photos:
c) Data Analysis:
After a week of allowing our radish seeds to germinate, our group took the pictures above to show some progress in our experiment. It was evident that sample #2 (6.0 salt concentration) would not be germinating soon and thus they would skew our data. Our group data does not show a trend, which is why I would be more inclined to use our class' averages to draw conclusions about the effects of salt on the growth of radish seeds. According the class data, less seeds will germinate as the salt concentration in the sample increases. By extrapolating the "Class Average of Seeds Not Germinated" graph, so that it reflects a logistic trend, the LD 50 of sodium chloride is estimated to be 15 g/L. On the other hand, the "Group Data on Seeds Not Germinated" shows an LD 50 of 4.5 g/L, which can be disproved by the same graph. This graph has multiple LD 50's, so it makes the data unreliable. Despite these discrepancies in the LD 50, some similarities present themselves when analyzing radicle growth. Both the class and group data show that the mean radicle lengths that the lower salt concentrations yield are slightly larger than those yielded by the distilled water (control). I would attribute this trend to the fact that salts can actually aid in vegetative growth. For example, farmers often use chemical fertilizers on their crops in order to increase crop yields. These fertilizers contain salts, but the benefits of using them can be outweighed by the disadvantages if they are overused. Too much fertilizer, or in this case sodium chloride, will eventually start to kill the plants as they absorb toxic levels of the chemical. Therefore, the graphs show that higher salt concentrations, including 6.0 g/L and 12.0 g/L, yield lower mean radicle lengths of the radish seeds than that of the distilled water.
Conclusions:
This lab was deliberated in order to answer the question of how radish seeds would respond to various concentrations of salt. The data collected could prove the hypothesis, which stated that an increase in the concentration of salt solution would hinder the germination and radicle growth of radish seeds , to be accurate to some extent. However, the discrepancies between the class data and individual group data can arouse some confusion. This can be attributed to some of the outliers that exist in the group. For instance, not one radish seed in sample #2 germinated, and the salt was clearly not the cause of this. Higher concentrations of salt still managed to have some growth, so this data was most likely skewed by another factor in the experiment. Perhaps the substances were not mixed correctly on day 1, or the seeds could have been bad from the start. For this reason, it is warranted to omit parts of the group data from the conclusions. However, if the focus is shifted from individual inconsistencies in the data to the overall trends that they provide, then the experiment gains significance. Both the class data and the group data show that both the germination and radicle growth of radish seeds are hindered by an increase in concentration of salt. Therefore, it is to this extent, the "big picture", that the data collected proves the hypothesis to be accurate.
To answer the focal question in this lab, it requires analysis of two trends. The first is the trend in germination, and the second is the trend in radicle length as the salt concentration is increased. The first one is what indicates the LD 50 of sodium chloride. By overlooking the outliers in the group data, it is obvious that the trend in germination is that less seeds will germinate as they are exposed to higher levels of salt. The LD 50 for the class data was estimated to be 15.0 g/L, which means that 50% of radish seeds are expected to die when the salt concentration is increased to 15.0 g/L. The reason that salt can be toxic to seeds in high amounts is that they need water to sprout, and salt does not help the cause. Salt actually dissolves in water, and when it does this "sodium and chloride ions separate and may then harm the [seeds]"(Perry, Leonard). A similar phenomenon goes on when salt is added to highways in order to deice them. Salt accumulation along roads can harm vegetation nearby because salt absorbs water, and "even though soil moisture may be plentiful, high amounts of salt can result in a drought-like environment for plants"(Perry, Leonard). Thus, salt can definitely be toxic to plants, and the effects do not stop at germination. The next trend in the class data shows that the radicle length of the radish seeds will actually increase when exposed to low levels of salt, but ultimately decrease when the salt concentration decreases. This trend is best explained through the concept of fertilizers. Fertilizers are great because they allow for increased crop yields in a world that needs more food to feed a growing human population. However, overusing fertilizers has been shown to decreases soil fertility and thus impede vegetative growth. Thus, the salts that the radish seeds are being exposed to are actually helping the seeds grow longer radicles, but the affect reverses itself once the salt concentration becomes too high. At this point, the salt makes it harder for the roots to absorb more water and thus they cannot grow past the length of the control or lower salt concentrations.
Citations:
Howard, Brian C. "The Surprising History of Road Salt." National Geographic, 12 Feb. 2014. Web. 16 Sept. 2014. <http://news.nationalgeographic.com/news/2014/02/140212-road-salt-shortages-melting-ice-snow-science/>.
Hydroville Curriculum Project. Backgrund Activity 9: Dose/Response Experiments Using Lettue Seeds. N.p.: Oregon State University, 2003. PDF file.
Perry, Leonard. "Salt Damage to Plants." University of Vermont. N.p., n.d. Web. 13 Sept. 2014 <http://www.uvm.edu/pss/ppp/articles/salt1.htm>.
