Collaborators:
David Delgado, Sona George, Brandon Garff, and Hailey Hendriks
David Delgado, Sona George, Brandon Garff, and Hailey Hendriks
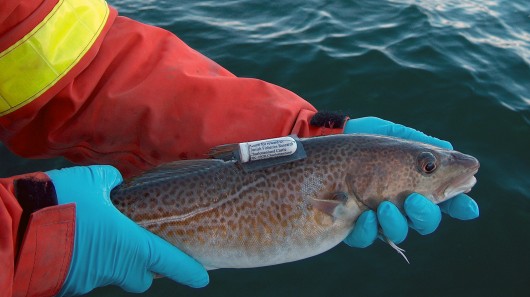
"Wildlife managers use 4 general approaches to estimate population sizes of wildlife: total counts, incomplete counts, indirect counts, and mark-recapture methods"(www.cals.ncsu.edu). This image exemplifies the mark-recapture method, which is what we used through the tagging of our fish.
Introduction & Problem:
The question being addressed by this lab is how effective is tagging in determining populations of species in an area. Tagging is a method of determining populations of a variety of species, including butterflies and fish, used by biologists. In addition, scientists can track migration patterns, health, and range by using this method. The goal of this method of "capture and release" may be to accurately hypothesize the population of a species, but this information can then be used to understand the factors that affect the size of a population. For example, we could ask ourselves how a species' habits, such as migration patterns, affect the validity of tagging in assessing population size. Furthermore, tagging can be used by scientists to study more complex relationships within nature. "Scientists are hoping the tagging study...can show the relationship between habitat health and fish populations"(Fodri, Joel F.). Therefore, the significance of this topic lies in understanding how tagging can contribute to a better understanding of a variety of species.
Hypothesis:
If the number of fish tagged is increased, then the percentage of tagged species in each sample will increase so as to produce a more accurate estimate of the fish species' population.
Parts of the Experiment:
Materials & Methods:
a) Materials:
b) Method:
Data & Data Analysis:
a) Data Table:
The question being addressed by this lab is how effective is tagging in determining populations of species in an area. Tagging is a method of determining populations of a variety of species, including butterflies and fish, used by biologists. In addition, scientists can track migration patterns, health, and range by using this method. The goal of this method of "capture and release" may be to accurately hypothesize the population of a species, but this information can then be used to understand the factors that affect the size of a population. For example, we could ask ourselves how a species' habits, such as migration patterns, affect the validity of tagging in assessing population size. Furthermore, tagging can be used by scientists to study more complex relationships within nature. "Scientists are hoping the tagging study...can show the relationship between habitat health and fish populations"(Fodri, Joel F.). Therefore, the significance of this topic lies in understanding how tagging can contribute to a better understanding of a variety of species.
Hypothesis:
If the number of fish tagged is increased, then the percentage of tagged species in each sample will increase so as to produce a more accurate estimate of the fish species' population.
Parts of the Experiment:
- The control group is the actual number of fish in the bowl (paper bag).
- The experimental group consists of the tagged species in the bag.
- The independent variable is the number of species tagged.
- The dependent variable is the percentage of tagged species that are recaptured, which is then used to estimate the size of the population.
- The controlled variables are the materials, including the the two types of beans used as fish.
Materials & Methods:
a) Materials:
- fish bowl (paper bag)
- untagged species (uncolored beans)
- tagged species (colored beans)
- pencil
- paper (data sheet)
b) Method:
- Obtain a bag with untagged fish (uncolored fish/beans).
- Do NOT count the number of fish in your pond yet.
- Have one member of your group remove a large handful of fish.
- Count the number of fish you just removed and record it under the "original number tagged" on your data table.
- Replace the fish with tagged fish (colored fish/beans).
- Mix your pond well to redistribute the tagged fish among the other fish.
- One member at a time (and without looking), remove a handful of fish and record the number of total fish in the sample, the number of tagged fish, and calculate the percentage of tagged fish. Record this information on your data table.
- Return your handful to the paper bag.
- Repeat the last two steps until you have taken 20 samples.
Data & Data Analysis:
a) Data Table:
b) Photos:
|
|
Photo #1: This is an example of a large catch size obtained in our lab (sample 2). Photo #2: Within our lab, this sample is on the smaller side in terms of catch size (sample 9). Photo #3: Total of untagged fish (uncolored beans) and tagged fish (colored beans). The total number of untagged fish can be used to represent the total number of fish in our pond. |
c) Data Analysis:
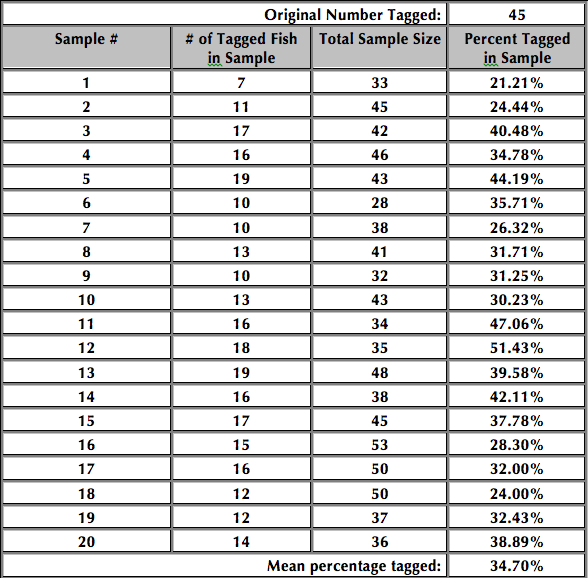
The mark-recapture method began to look more redundant as our group took sample after sample. By simply looking at the disparities in our data, it is evident that no correlation exists between the number of species tagged and the percent of tagged species recaptured. For example, our sample #1 had 21.21% of the total sample tagged while sample #12 had 51.43% tagged. This demonstrates that despite the fact that the number of tagged species remains the same (45 in this case), it is highly unlikely for two different samples to have the same percentage of tagged fish. Therefore, the accuracy of the estimate acquired through this method depends more on the laws of probability than on the independent variable, which is the original number of fish tagged. This observation brings up the question of whether or not this trend would apply if the number of tagged species were increased. The data we recorded proves that having a constant number of tagged species in a certain location yields various percentages of tagged species found in each sample. However, what would happen if the original number of tagged species were increased? Would there be less disparities in our data, and thus yield a more accurate approximation of the size of the population? I believe that this would be the case. Therefore, a completely different trend exists for this extreme of the spectrum. The data would have less outliers if the number of tagged species were very large. In other words, a larger number of tagged organisms would yield the most accurate predictions of population size in this lab. The reason that our data had such a wide rage of percentages for the recaptured tagged species is that there were many tagged and untagged species in our pond. As a result, samples produced very distinct percentages, which helps explain why our data did not yield an accurate estimate of the size of the fish population.
Conclusions:
a) Conclusion Questions:
1. What is the mean (average) of your percent tagged fish from your 20 samples?
34.70%
2. Using the following formula, determine an estimated population for your pond:
Population Size = (Number Originally Tagged/Mean of the Sample %'s) × 100
The estimated population obtained for our pond was about 130 fish.
3. Now actually count the number of fish in your bowl: 163 fish
4. Find your percentage error by using the following formula: 20.25% error
100 × (abs(Your estimate of population - Actual size of population)) / (Actual size of population)
5. Does this method appear to be an effective way to assess population size? Why or why not?
The mark-recapture method does not appear to be an effective way to assess population size. Even on the small-scale that this lab was conducted, out estimate still produced a large percent error. If biologists were to use this method to assess population size on a larger scale, such as in the ocean, then the results would probably be even more inaccurate. The reason for this is that this method of tagging is based on probability in order to assess population size. Since the probability of recapturing tagged organisms in a large area is very low, then the percentage of tagged species in the samples would be much more deceiving when it comes to estimating the population size. In short, there appears to be no correlation between the number of tagged animals (independent variable) and the estimated population size (dependent variable). Therefore, the results will vary even if the number of tagged species was kept the same.
6. What concerns should a biologist have about a species' habits before (s)he uses this method to approximate the size of a population?
A biologist should understand that animals in nature rarely settle in one place, but instead migrate based on their perception of push and pull factors. For this reason, a biologist should be concerned about how the migration patterns of certain species affect the reliability of tagging in approximating the size of a population. For example, a National Marine Fisheries Service (NMFS) study found that fish change their migratory patterns as they grow. This information is important for biologists to understand because it would allow them to avoid tagging in an area where very few of the tagged species are expected to reside. In fact, some scientists use tagging as a method to study only migration patterns. By doing this, biologists studying species such as North Carolina's Red Drum place more emphasis on a species' habits and habitat instead of the size of the population. I believe that this is a more useful application of tagging, and it should be a bigger concern than estimating the size of a population. In addition, biologists should be concerned with how certain species interact with their habitats, and how they respond to problems in their environment.
b) Conclusion:
Although the results of this experiment do not directly prove the hypothesis to be true, they do support it indirectly.The hypothesis states that a larger number of tagged organisms should yield higher percentages of tagged species as well as more accurate predictions of population size. However, we did not tag a large number of fish, and therefore the estimation that was produced was very inaccurate. There were not many things which could account for this inaccuracy, except for the variations in catch size. Even so, the total sample size was not shown to affect the number of tagged fish recaptured. For example, in sample #17 and #18, the total sample size was the same and yet the yielded a different percent of tagged species in the sample. Overall, the results of this experiment seem to be determined by probability.
Despite the fact that this experiment demonstrates that there is no correlation between the independent and dependent variable, I cannot help but question how the results would have changed if the number of tagged species were increased. To answer my own question, it makes sense that by increasing the number of tagged species in our pond would be the same as counting most of the fish. Therefore, this allows for a more accurate estimate of the size of the population. However, is this a practical solution to finding the size of a population in a larger area? It is not, and that is why biologists have other ways of approximating the size of a population besides the mark-recapture method. Even if tagging did not prove to be a useful method when it comes to finding the size of a population, it can still be applied by scientists in order to study other aspects of a habitat. For example, one can learn more about migration patterns in an area by using tagging studies along with other studies on a specific species.
Citations:
Fodri, Joel F. " Fish Tagging." Fish Tagging. UNCTV, n.d. Web. 07 Sept. 2014. <http://science.unctv.org/content/fish-tagging-0>.
Norris, Kara. Something’s Fishy – Population study lab. N.p. PDF file.
"Why Tag Fish?" American Littoral Society. N.p., n.d. Web. 07 Sept. 2014. <http://www.littoralsociety.org/index.php/programs/fish-tagging/why-tag-fish>
